Mycotoxin Prevalence across Indian subcontinent and trends of mycotoxins in different raw materials and feeds
- Feed Safety
By Dr. Stuti Baruah, Program Manager – Feed Safety, Trouw Nutrition South Asia
Mycotoxicosis in poultry refers to the condition where poultry birds, such as chickens or turkeys, are affected by toxins produced by certain types of fungi known as mycotoxins. These mycotoxins can contaminate the feed or bedding materials used for poultry, leading to various health issues and reduced productivity.
Mycotoxicosis can manifest in different ways depending on the specific mycotoxin involved and the level of exposure. Common symptoms include reduced feed intake, weight loss, poor growth, decreased egg production, immune suppression, and increased susceptibility to infections. In severe cases, it can even lead to mortality.
Prevention and control of mycotoxicosis in poultry involve several measures. These include proper storage and handling of feed to minimize fungal growth and mycotoxin production, regular monitoring of feed quality for mycotoxin contamination, and the use of mycotoxin binders or detoxifiers in the feed to reduce the negative effects of mycotoxins on poultry health.
It is important for poultry farmers to be aware of the potential risks of mycotoxicosis and take appropriate measures to mitigate them, as it can have significant economic implications and impact the overall welfare of the birds. Regular consultation with veterinarians or poultry nutritionists can provide further guidance on managing mycotoxin-related challenges in poultry production.
Understanding trends and patterns: Trouw Nutrition conducts routine survey that provide valuable insights into trends and patterns of mycotoxin distribution in India.
Informed decision-making: Survey data can be used to take conscious decision in screening raw materials, categorise vendors and implement holistic mycotoxin programs.
Evaluating effectiveness: Mycotoxin prevalence reports can be used to assess the effectiveness of interventions/programs in poultry production systems.
In 2022, Trouw Nutrition India analyzed 2184 samples in Masterlab in Jadcherla, Hyderabad. This article discusses the results of the survey
Table1: Total Summary of Mycotoxin contamination
|
Mycotoxin |
Total |
Total Contaminated |
Average |
Median |
Minimum |
Maximum |
% Contaminated |
|
AFLA |
1433 |
1301 |
43 |
22 |
3 |
150 |
91 |
|
DON |
49 |
|
|
|
|
|
0 |
|
FUM |
198 |
137 |
1611 |
1100 |
250 |
5500 |
69 |
|
OCHRA |
322 |
279 |
16 |
11 |
2 |
150 |
87 |
|
T2HT2 |
135 |
10 |
37 |
15 |
10 |
175 |
7 |
|
ZEA |
47 |
43 |
102 |
79 |
28 |
305 |
91 |
Out of 2184 samples ,1433 samples were tested for Aflatoxin ,out of which 1301 were contaminated. Highest concentration is 150 ppb. 91% of samples were contaminated by Aflatoxin. 87% of samples (322) were contaminated by Ochratoxin. Highest concentration was 150 ppb which is very high.
T2 toxin contamination was 7% out of 135 samples. Occurrence of T2H2 mycotoxin is commonly seen in some raw materials.
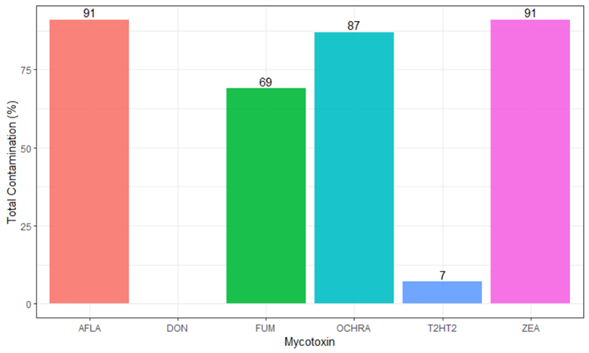
Graph 1 : Summary of Total Mycotoxin contamination for different mycotoxins
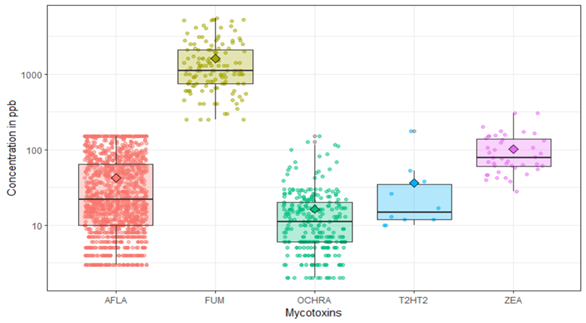
Graph 2: Summary of Multiple mycotoxin contamination (Concentration in ppb)
Commodity Wise:
Grains had 98% contamination levels for Aflatoxin. Highest contamination was seen in Protein meal and feed (95%) followed by by-product and animal product (81% and 80%). 92% of feed was contaminated with Fumonisins and 45% in Protein meal. Ochratoxin was more prevalent in feed (96%) and protein meals (95%).
Lesser samples were there for T2H2 but 11% contamination in feed followed by 5% in by-product. Zearalenone is being seen in almost all the commodities.
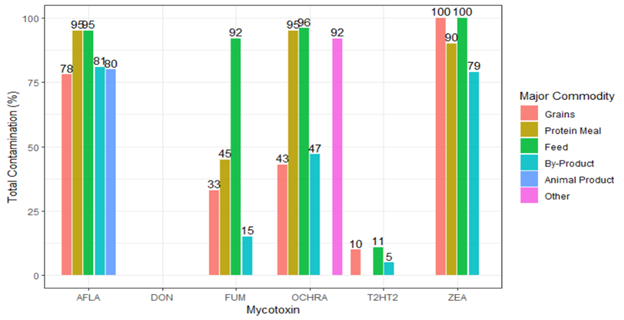
Graph 3: Summary of Total Contamination (%) in Major Commodities
Aflatoxin: Below table shows commodity wise contamination of Aflatoxin. Almost 95% feed samples tested were contaminated with Aflatoxin with average concentration of 37ppb. Grains had highest average concentration of 68 ppb.
Table 2: Summary of Aflatoxin Contamination in Major Commodities
|
Major Commodity |
Total |
Total Contaminated |
Average |
Median |
Minimum |
Maximum |
% Contaminated |
|
Animal Product |
5 |
4 |
5 |
5 |
3 |
7 |
80 |
|
By-Product |
94 |
76 |
12 |
5 |
3 |
82 |
81 |
|
Feed |
868 |
826 |
37 |
20 |
3 |
150 |
95 |
|
Grains |
281 |
220 |
68 |
56 |
3 |
150 |
78 |
|
Protein Meal |
185 |
175 |
53 |
46 |
3 |
150 |
95 |
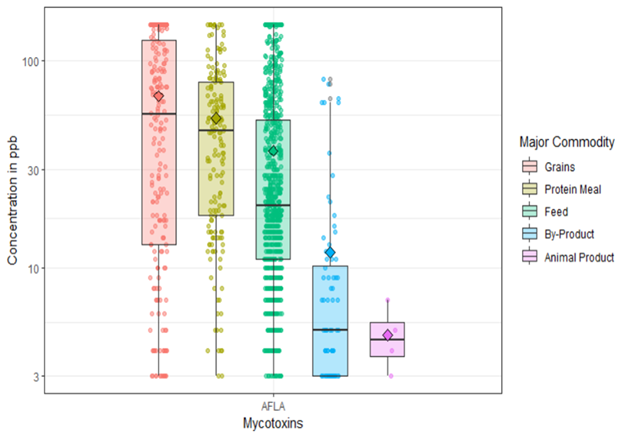
Graph 4: Summary of Aflatoxin Contamination Distribution in Major Commodities
Fumonisin: 124 of feed samples tested, 92% were contaminated with Fumonisins. Grains had highest average concentration of Fumonisins (2100 ppb)
Table 3: Summary of Fumonisin Contamination in Major Commodities
|
Major Commodity |
Total |
Total Contaminated |
Average |
Median |
Minimum |
Maximum |
% Contaminated |
|
Animal Product |
2 |
|
|
|
|
|
0 |
|
By-Product |
26 |
4 |
438 |
450 |
250 |
600 |
15 |
|
Feed |
124 |
114 |
1638 |
1150 |
250 |
5500 |
92 |
|
Grains |
15 |
5 |
2630 |
2100 |
250 |
5300 |
33 |
|
Protein Meal |
31 |
14 |
1364 |
1125 |
500 |
3000 |
45 |
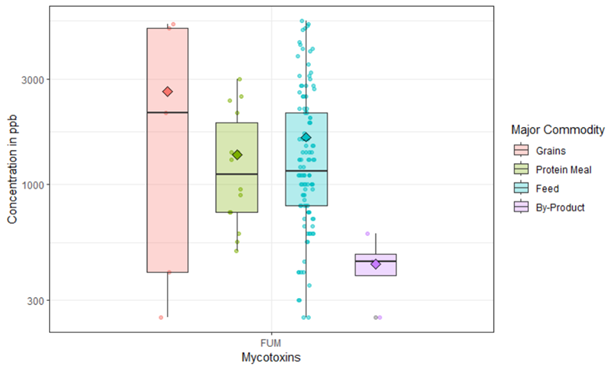
Graph 5: Summary of Fumonisin Contamination Distribution in Major Commodities
Ochratoxin: 95% of feed samples were Ochratoxin contaminated with average concentration of 13 ppb. Protein meal had highest average concentration of 27 ppb and 95% contamination levels.
Table 4: Summary of Ochratoxin Toxin Contamination in Major Commodities
|
Major Commodity |
Total |
Total Contaminated |
Average |
Median |
Minimum |
Maximum |
% Contaminated |
|
Animal Product |
2 |
0 |
|
|
|
|
0 |
|
By-Product |
30 |
14 |
7 |
5 |
2 |
20 |
47 |
|
Feed |
179 |
172 |
13 |
10 |
2 |
59 |
96 |
|
Other |
23 |
10 |
22 |
5 |
2 |
150 |
43 |
|
Grains |
12 |
11 |
10 |
7 |
2 |
27 |
92 |
|
Protein Meal |
76 |
72 |
27 |
21 |
2 |
127 |
95 |
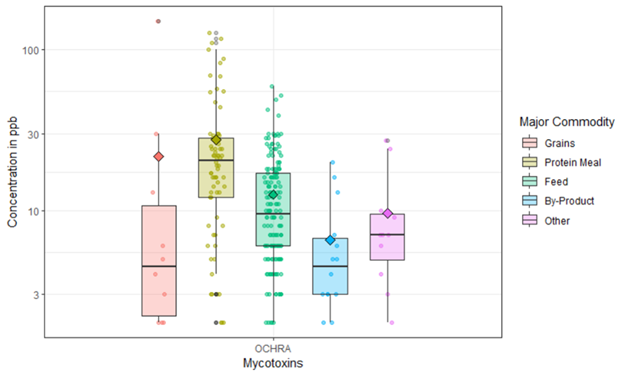
Graph 6:Summary of Ochratoxin Contamination Distribution in Major Commodities
T2-HT2
The rising risks from T2-HT2 is alarming. Out of 76 feed samples, 11% contamination seen. Highest concentration seen up to 175 ppb in feed.
Gizzard erosions and tear in buccal region is commonly seen in birds consuming high concentration of T2-HT2 toxins.
Table 5: Summary of T2-HT2 Toxin Contamination in Major Commodities
|
Major Commodity |
Total |
Total Contaminated |
Average |
Median |
Minimum |
Maximum |
% Contaminated |
|
Animal Product |
3 |
0 |
|
|
|
|
0 |
|
By-Product |
22 |
1 |
10 |
10 |
10 |
10 |
5 |
|
Feed |
76 |
8 |
43 |
21.5 |
10 |
175 |
11 |
|
Grains |
10 |
1 |
12 |
12 |
12 |
12 |
10 |
|
Other |
4 |
0 |
|
|
|
|
0 |
|
Protein Meal |
20 |
0 |
|
|
|
|
0 |

Graph 7: Summary of T2-HT2 Toxin Contamination Distribution in Major Commodities
Zearalenone: 100% of feed and grains showed Zea contamination. 90% of protein meals were contaminated with Zearalenone.
Table 6: Summary of Zearalenone Contamination in Major Commodities
|
Major Commodity |
Total |
Total Contaminated |
Average |
Median |
Minimum |
Maximum |
% Contaminated |
|
By-Product |
14 |
11 |
121 |
107 |
62 |
202 |
79 |
|
Feed |
20 |
20 |
61 |
57 |
28 |
176 |
100 |
|
Grains |
3 |
3 |
99 |
106 |
66 |
124 |
100 |
|
Protein Meal |
10 |
9 |
171 |
150 |
80 |
305 |
90 |
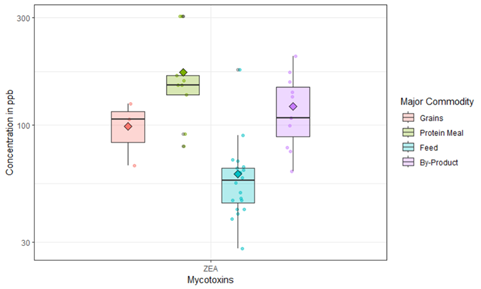
Graph 8: Summary of Zearalenone Contamination Distribution in Major Commodities
Seasonal Trends of Aflatoxin in different commodities: Mycotoxin concentrations in corn change throughout the year depending on the growing conditions in the field as well as storage conditions. As can be seen in the Figure 1, AF concentrations showed three peaks in the year in the months of February, July, and October. Each one of the mycotoxins showed different peaks indicating the differences in the conditions required for their production. The sizeable quantity of corn produced in 2022 will be used at least until Q1 of 2023 and hence studying such month-to-month variations can provide some tips for effective mycotoxin risk management.
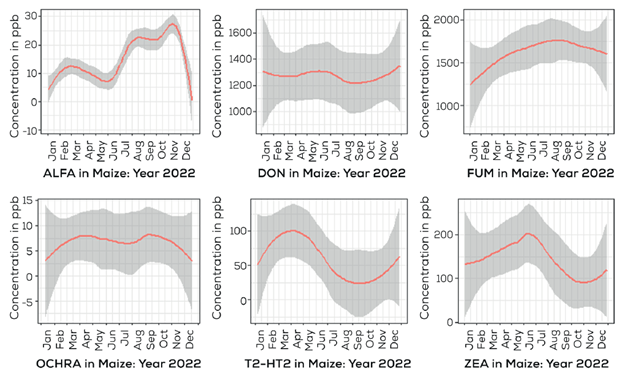
Fig1 : Month-to-Month variation in mycotoxin concentrations (ppb)
Summary of Mycotoxin Distribution in Maize in India:
Maize where most tested mycotoxin is Aflatoxin, Ochratoxin and T2HT2 is seen to be on the rise.
Table 7: Summary of Mycotoxin Distribution in Maize
|
Mycotoxin |
Total |
Total Contaminated |
Average |
Median |
Minimum |
Maximum |
% Contaminated |
|
AFLA |
271 |
211 |
69 |
57 |
3 |
150 |
78 |
|
DON |
1 |
|
|
|
|
|
|
|
FUM |
12 |
5 |
2630 |
2100 |
250 |
5300 |
42 |
|
OCHRA |
18 |
7 |
28 |
4 |
2 |
150 |
39 |
|
T2HT2 |
10 |
1 |
12 |
12 |
12 |
12 |
10 |
|
ZEA |
3 |
3 |
99 |
106 |
66 |
124 |
100 |
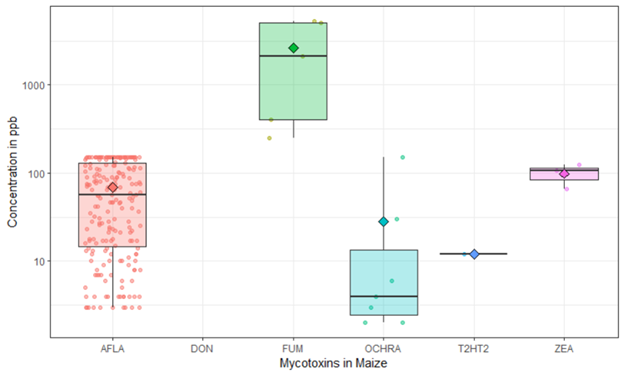
Graph 9: Summary of Mycotoxin contamination Distribution in Maize
SPECIES RISK ASSESSMENT
Different species have specific sensitivities to mycotoxin exposure and specifically young and reproducing animals can have more severe responses. When evaluating corn and formulating feeds, it is important to consider the types and concentrations of mycotoxins that may be present in corn. For example, corn with higher ZEA can be fed to poultry rather than sows. High concentrations of any mycotoxin in corn should be dealt with caution as corn represents more than 50% of most animal diets. It is also important to note that corn is not the only ingredient used in the animal feed. In addition to considering the mycotoxin contribution from corn to the complete feed, the contribution of other ingredients should also be evaluated to understand the total mycotoxin risk. For example, corn DDGS used at low levels of inclusion in poultry feed can contribute to high levels of DON in the complete feed as compared to corn itself.
MYCOTOXIN MITIGATION
Feeds contaminated with a range of mycotoxins expose livestock and poultry to multiple challenges threatening various internal organs and systems. For example, the presence of AF, fumonisins and OTA can damage the liver and kidneys and interfere with immune system function, while ZEA interrupts the reproductive system. T2/HT2 toxins and DON damage the gut and immune system functions. All the mycotoxins cannot be managed with the same mitigation strategy. For example, AF respond well to binding agents, while Fumonisins and DON, don’t bond well to agents added to feeds. Mitigation tools must contain multiple modes of action, to reduce the bioavailability of mycotoxins, and ingredients capable of enhancing immunity, gut health, and antioxidant status of animals.
CONCLUSIONS
Undoubtedly corn is the major raw material used in feed to meet the nutrient demands of livestock and poultry. Despite the efforts from animal scientists and industry professionals, it has not been possible to find a cost-effective alternative to corn. Due to the changing agricultural practices and climate change, mycotoxin contamination in corn is steadily increasing. On top of this, more and more mycotoxins are held responsible for their negative effects on subtle parameters such as gut health, immunity, and antioxidant status. If the future mycotoxin regulations are based on such subtle parameters, mycotoxin limits in animal feeds must come down further. This will certainly put pressure on acceptable limits of mycotoxins in corn. Innovations are needed to improve the overall resilience of animals against a broad range of multiple mycotoxins.
For further information, kindly write to us at customercareindia@trouwnutrition.com or visit our website: www.trouwnutrition.in